
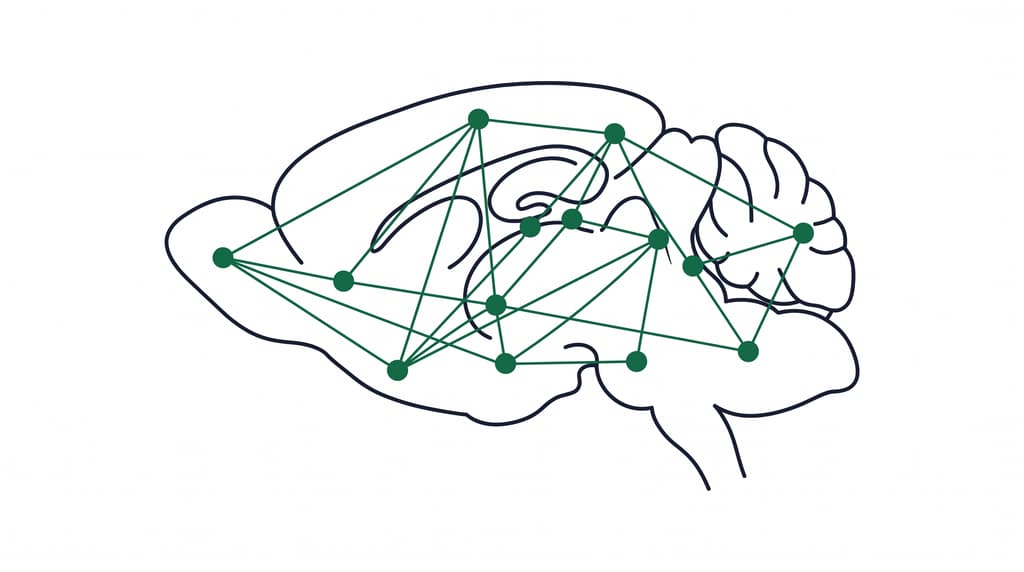
For most of neuroscience’s history, researchers studied the brain one region at a time, pick a structure, record from it, lesion it, and infer its role. But addiction is not a one-region disease. It reorganizes communication among dozens of regions at once. Understanding it requires seeing the whole network, a connectomic view of the brain.
Two technical revolutions have made that view possible in the laboratory.
Seeing every active neuron in an intact brain
The first revolution is tissue clearing. Methods like iDISCO render an intact rodent brain optically transparent while preserving labeled molecules within it (Renier et al., 2014). Combined with light-sheet microscopy and antibodies against activity markers such as Fos, researchers can image every activated neuron in the entire brain at single-cell resolution: no slicing, no sampling, no guessing about the regions not examined.
Each brain becomes a three-dimensional map, a “brainprint”, of which cells were engaged by an experience: intoxication, withdrawal, or craving.
From maps to networks
The second revolution is analytical. Once activity is quantified across hundreds of brain regions, graph theory, the mathematics of networks, can describe how those regions function together: which regions co-activate, which act as hubs, and how information flow is organized into modules.
Applied to alcohol dependence, this approach produced a striking result. In abstinence, the brains of alcohol-dependent mice did not simply show more or less activity, their functional architecture was reorganized: modularity decreased and regional relationships were remodeled brain-wide, a network signature of the dependent state (Kimbrough et al., 2020). Addiction, in the network view, is not a broken region. It is a rewired system.
Adding the time dimension: longitudinal MRI
Whole-brain cellular imaging captures a single moment, the brain must be examined post-mortem. Magnetic resonance imaging complements it by tracking the same living animal across the entire arc of addiction: before drug exposure, during escalation, in withdrawal, and after abstinence. In genetically diverse rats, longitudinal MRI can reveal whether network differences precede compulsive use (a vulnerability marker) or emerge with it (a consequence of drug exposure), one of the field’s most important unanswered questions.
What PARC’s connectomics project asks
Our Brain Connectomics project applies these tools across alcohol, opioid, and cocaine cohorts drawn from the same genetically diverse population, phenotyped on the same behavioral pipeline. The questions are direct:
- Do the network signatures of dependence converge across substances, or does each drug rewire the brain its own way?
- Which network features distinguish vulnerable from resilient individuals: and are they visible before the first dose?
- How do network changes align with the gene-expression changes mapped in the same animals (single-cell transcriptomics) and with gut–brain signals?
Those alignments, network, molecule, and body, in the same individual, are the core of the center’s One-Individual Multiscale Atlas.
References
- Renier N et al. (2014). iDISCO: a simple, rapid method to immunolabel large tissue samples for volume imaging. Cell 159:896–910. PMID 25417164
- Kimbrough A et al. (2020). Brain-wide functional architecture remodeling by alcohol dependence and abstinence. PNAS 117:2149–2159. PMID 31937658